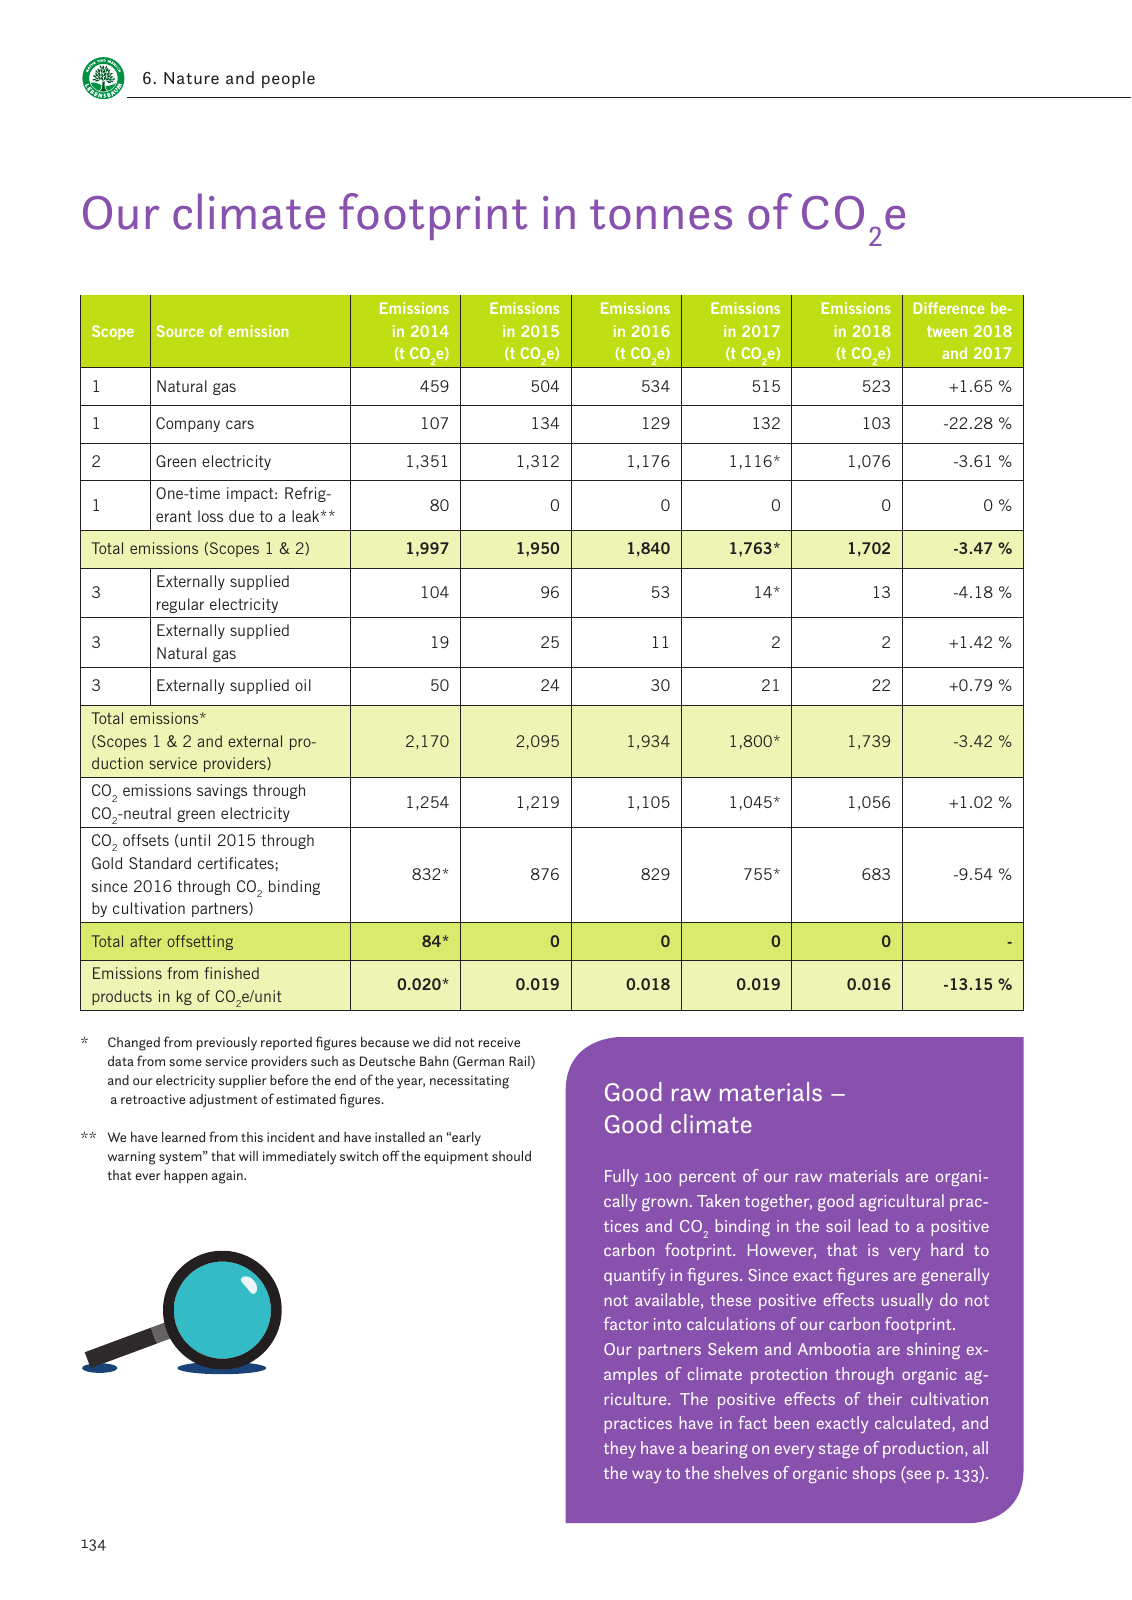
134 Good raw materials Good climate Fully 100 percent of our raw materials are organi cally grown Taken together good agricultural prac tices and CO 2 binding in the soil lead to a positive carbon footprint However that is very hard to quantify in figures Since exact figures are generally not available these positive effects usually do not factor into calculations of our carbon footprint Our partners Sekem and Ambootia are shining ex amples of climate protection through organic ag riculture The positive effects of their cultivation practices have in fact been exactly calculated and they have a bearing on every stage of production all the way to the shelves of organic shops see p 133 6 Nature and people Changed from previously reported figures because we did not receive data from some service providers such as Deutsche Bahn German Rail and our electricity supplier before the end of the year necessitating a retroactive adjustment of estimated figures We have learned from this incident and have installed an early warning system that will immediately switch off the equipment should that ever happen again Scope Source of emission Emissions in 2014 t CO2e Emissions in 2015 t CO2e Emissions in 2016 t CO2e Emissions in 2017 t CO2e Emissions in 2018 t CO2e Difference be tween 2018 and 2017 1 Natural gas 459 504 534 515 523 1 65 1 Company cars 107 134 129 132 103 22 28 2 Green electricity 1 351 1 312 1 176 1 116 1 076 3 61 1 One time impact Refrig erant loss due to a leak 80 0 0 0 0 0 Total emissions Scopes 1 2 1 997 1 950 1 840 1 763 1 702 3 47 3 Externally supplied regular electricity 104 96 53 14 13 4 18 3 Externally supplied Natural gas 19 25 11 2 2 1 42 3 Externally supplied oil 50 24 30 21 22 0 79 Total emissions Scopes 1 2 and external pro duction service providers 2 170 2 095 1 934 1 800 1 739 3 42 CO2 emissions savings through CO2 neutral green electricity 1 254 1 219 1 105 1 045 1 056 1 02 CO2 offsets until 2015 through Gold Standard certificates since 2016 through CO2 binding by cultivation partners 832 876 829 755 683 9 54 Total after offsetting 84 0 0 0 0 Emissions from finished products in kg of CO2e unit 0 020 0 019 0 018 0 019 0 016 13 15 Our climate footprint in tonnes of CO 2 e
Hinweis: Dies ist eine maschinenlesbare No-Flash Ansicht.
Klicken Sie hier um zur Online-Version zu gelangen.
Klicken Sie hier um zur Online-Version zu gelangen.